Want to understand what your visitors actually do on your site and turn that into better results? This practical guide to Google Analytics 4 walks you step by step through installing, configuring and mastering GA4, so your data becomes concrete actions that grow your online presence.
From creating your Google Analytics account to in-depth analysis of your conversions, you'll see how GA4 becomes the tool you can't do without for tracking the user journey, spotting your best traffic sources and optimising every page on your site.
Our approach: this guide is built on proven web analytics and SEO techniques. Every tip has been tested to help you avoid the common mistakes and get the most out of your Google Analytics data.
Install and configure Google Analytics 4 the right way
Setting up Google Analytics 4 starts with a well-organised account. Get this step right and every report you read later will be clear and reliable.
Create your account and your GA4 property
Start by signing in with your Google account (Gmail or Google Workspace). Then pick an organisation name that reflects your business.
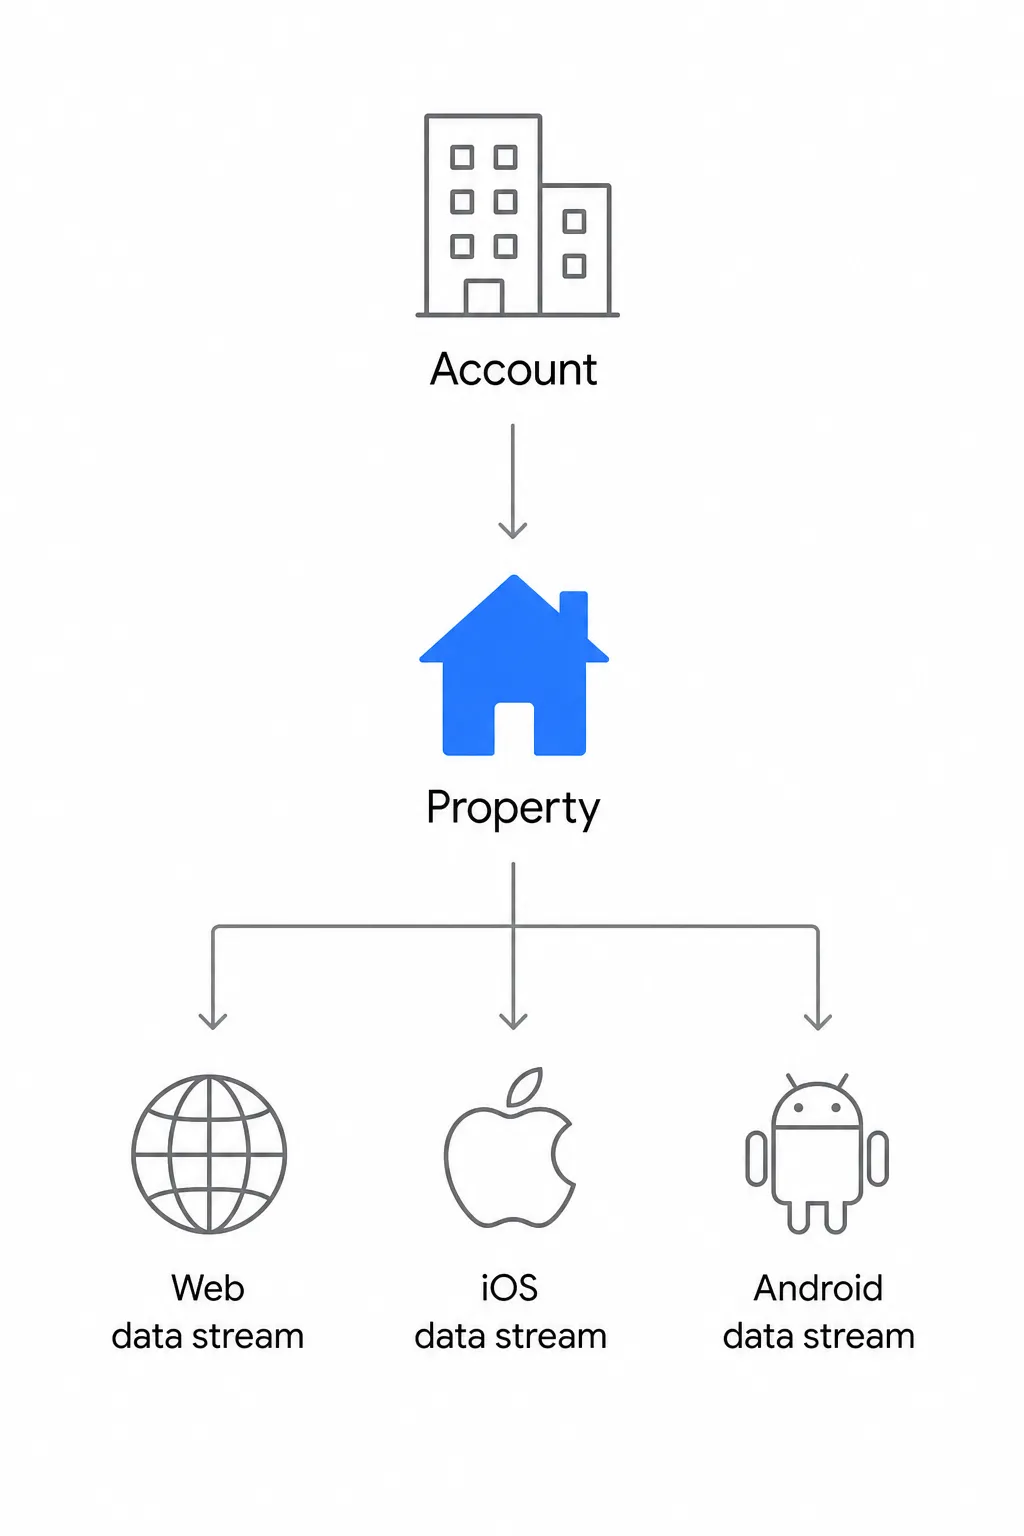
Google Analytics 4 works with a three-level structure: Account > Property > Data stream.
- Account: the top-level container that groups all your properties.
- Property: represents your website or app and gathers all its data.
- Data stream: the exact source of the information (Web, iOS, Android).
Big change: the "Views" from Universal Analytics are gone in GA4. Filtering now happens directly in explorations and reports, although the page_view event remains essential for tracking.Step-by-step: setting up your account properly
- Create your account: sign in with your Google account and give the account a clear name.
- Create a GA4 property: name it after your site (for example "sedestral-en"), then select your time zone and currency.
- Add a Web data stream: enter your site's full URL. Turn on Enhanced Measurement to automatically capture scrolls, outbound clicks, file downloads and video interactions.
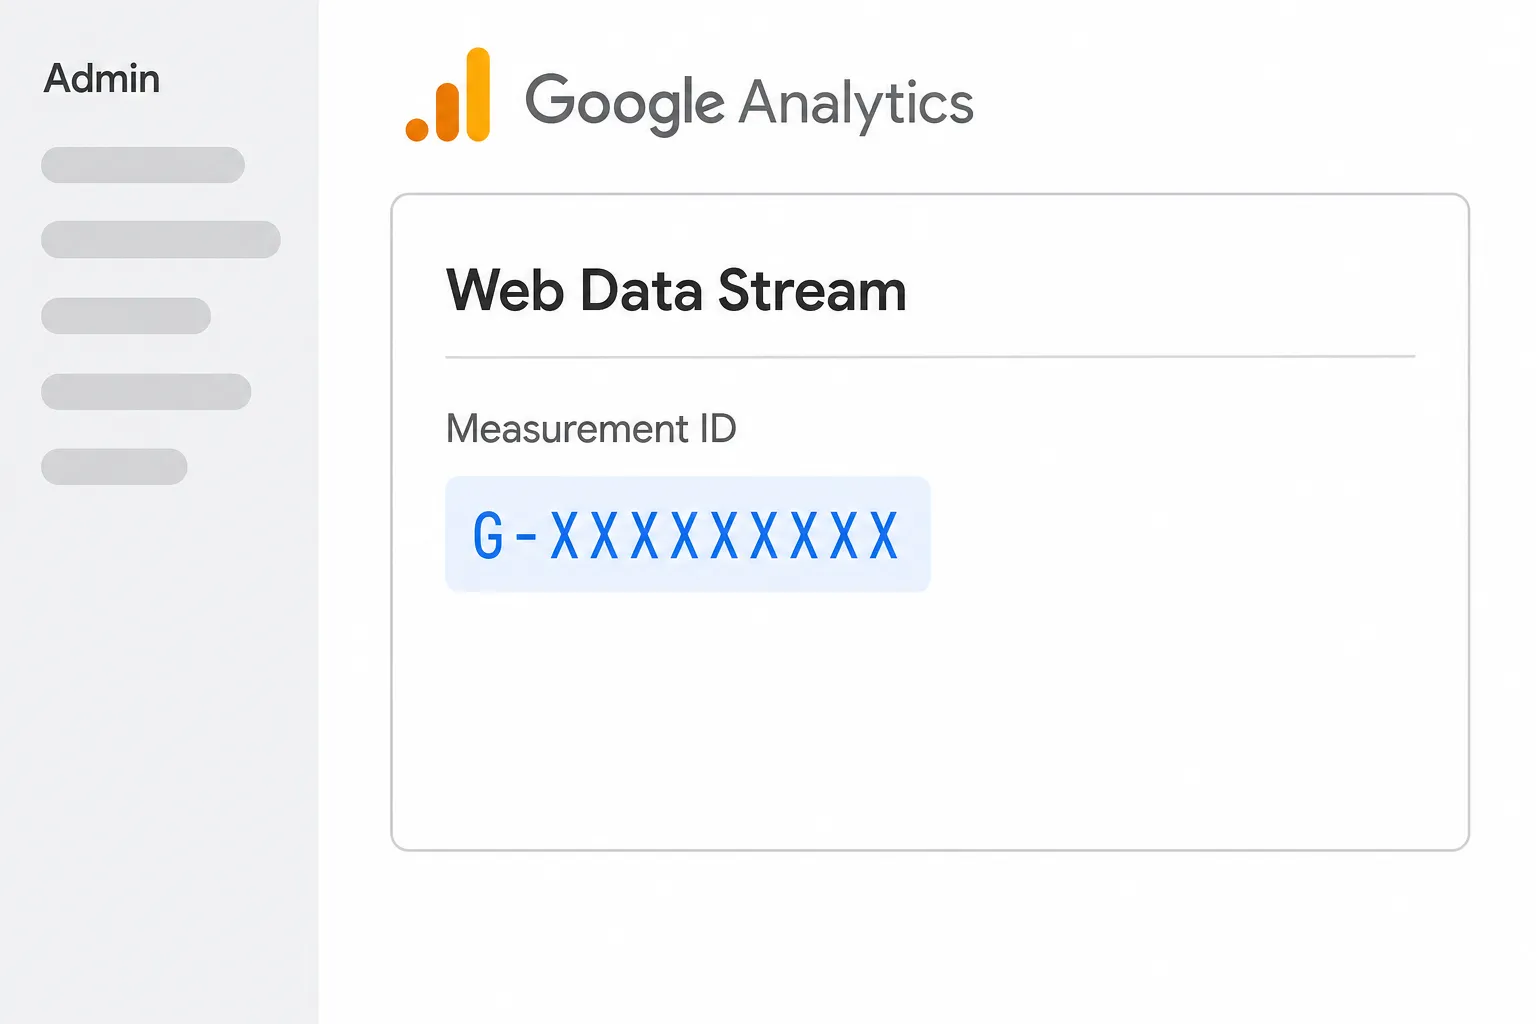
- Grab your Measurement ID: note down the identifier in the
G-XXXXXXXXXXformat. You'll need it to install the tag on your site.
Set the essential settings from day one
Before you install the tag, lock in the fundamental settings:
- Time zone: choose the one that matches your business so your reports stay consistent.
- Data retention: standard properties offer 2 or 14 months. Pick 14 months, which works fine for GDPR and UK GDPR purposes, unless your legal team says otherwise.
- Filter internal traffic: exclude your own IP addresses so you don't skew your stats (
Admin > Data streams > Configure tag settings > Define internal traffic). - Define your key events: identify the actions that matter (purchases, sign-ups...) right away and mark them as key events, which is what GA4 now calls conversions (
Admin > Events > Key events).
Deploy the Google Analytics tag with Google Tag Manager
Once your Google Analytics property is ready, add the tracking code to every page. We strongly recommend using Google Tag Manager (GTM) for the extra flexibility it gives you.
Install GA4 via Google Tag Manager (recommended method)
GTM lets you manage your tags without touching the source code, which makes updates and event tracking a lot simpler.
- Create a GTM account at tagmanager.google.com if you don't have one yet.
- Install the GTM container: add the two code snippets (in
<head>and<body>) on every page. - Create a GA4 tag:
- In GTM, add a new tag of type "Google Tag".
- Enter your Measurement ID
G-XXXXXXXXXX. - Apply the "All Pages" trigger.
- Enable Consent Mode: stay GDPR compliant by waiting for the user's consent.
- Test in Preview mode before publishing.
Tip: Google Tag Manager makes it easy to add new tags (ads, heatmaps...) without editing the code, which is a real time-saver.
Alternative installs: gtag.js and CMS plugins
If GTM isn't for you, here are two other options:
- Manual method (gtag.js): place the GA4 script in the
<head>of every page. Simple, but less flexible. - CMS plugins: on WordPress or Shopify, use an extension such as Site Kit or the native Google & YouTube app. Convenient, but less customisable.
Check that tracking works properly
Right after installing, check that data is coming through and that your Google Analytics tag is feeding your reports correctly.
- Realtime report: open your site in a new tab and go to
Reports > Realtimein Google Analytics. Your visit should show up within seconds. - DebugView: switch on debug mode (use Tag Assistant or GTM Preview mode, or set the
debug_modeparameter in your Google tag) to inspect every event sent, in detail. - Tag Assistant extension: install the official Chrome extension to confirm that your Google Analytics and GTM tags are present and firing as expected.
Allow 24 to 48 hours for the full Google Analytics reports to populate. Realtime data shows up immediately, but the other sections need processing time.
Link Google Analytics to Search Console to boost your SEO
Sharpen your SEO analysis by connecting GA4 to Google Search Console. You'll be able to cross impressions, clicks, CTR and positions (Search Console) with post-click behaviour (Analytics) to optimise your titles, metadata and content.
Set up the GA4 ↔ Search Console link
- In Google Analytics, go to
Admin > Product links > Search Console links. - Click "Link" and select the Search Console property associated with your site.
- Confirm the connection. Search Console data will appear in your GA4 reports within 24 to 48 hours.
To master Search Console and uncover your SEO opportunities, read our Google Search Console: the complete guide.
Use the combined reports to optimise your content
Once the link is active, you get richer reports:
- Organic queries: identify the keywords generating impressions and clicks, then check their engagement rate in GA4.
- SEO landing pages: spot the pages that attract organic traffic and assess their bounce rate and conversions.
- CTR opportunities: find queries with high volume but a low CTR, then optimise titles and metadata to win more clicks.
- Performance by device: compare desktop and mobile to prioritise UX fixes (for example, speed up mobile pages if their bounce rate is high).
Real-world example: a page with 1,000 impressions but only 20 clicks (2% CTR) can double its CTR to 4-5% with a better title and meta description, bringing 40-50 extra clicks without moving up a single position.
Understand the key Google Analytics 4 reports
As soon as the first data starts flowing in, explore the essential reports. GA4 organises everything around the user lifecycle: acquisition, engagement, monetisation and retention.
Acquisition: where do your visitors come from?
The Acquisition report (Reports > Life cycle > Acquisition > Traffic acquisition) reveals your originating channels:
- Source / Medium: google / organic (SEO), google / cpc (Google Ads), facebook / social, newsletter / email, and so on.
- Users and sessions: visit volume per channel. A session groups interactions within a 30-minute activity window.
- Conversion rate by source: see which channels bring the most conversions (forms, purchases, sign-ups).
Filter the report on "Organic Search" to isolate your SEO performance. Compare it with Search Console data to refine your strategy. New to SEO? Our beginner's guide to SEO takes you through it step by step.
Engagement: how users interact with your site
GA4 focuses on engagement rather than raw page views. The Engagement report (Life cycle > Engagement) shows you:
- Engagement rate: percentage of engaged sessions (longer than 10 seconds, or 2+ page views, or a conversion). A key indicator of traffic quality.
- Average engagement time: the real time spent on your site (active tab). It replaces the less reliable "session duration" of the old version.
- Main events: page_view, scroll, click, file_download, form_submit, etc. All the events collected automatically via Enhanced Measurement or configured manually.
- Pages and screens: your most-viewed pages, with their engagement rate and their contribution to conversions.
Shift in thinking: the classic "bounce rate" is no longer the central metric. Focus on engagement rate and engagement time to measure the real quality of your visits.
Monetisation: track revenue and transactions
If you run an e-commerce site, the Monetisation report (Life cycle > Monetisation) centralises your sales performance:
- Total revenue: turnover generated, broken down by source, campaign or product.
- Transactions: number of completed purchases.
- Average order value: average revenue per transaction.
- E-commerce funnel: the view_item > add_to_cart > begin_checkout > purchase journey, to pinpoint friction.
To feed this report, you need to implement e-commerce tracking (see the next section).
Set up event and conversion tracking
Events are the heart of GA4. Every interaction (click, scroll, download, purchase) is an event. Some are automatic, others need manual configuration.
Enable and extend Enhanced Measurement
When you create your data stream, enable Enhanced Measurement to automatically collect:
- Page views (page_view)
- Scrolls (scroll): fires at 90% depth
- Outbound clicks (click)
- Site search (view_search_results)
- File downloads (file_download)
- Video engagement (video_start, video_progress, video_complete)
These events are enabled by default under Admin > Data streams > Enhanced measurement. Adjust the settings if needed (for example, the file extensions to track).
Create custom events with Google Tag Manager
To track specific interactions (form submission, click on a CTA button, 50% scroll), create custom events via GTM:
- Create a trigger in GTM (e.g. a click on the "Request a demo" button).
- Create a "Google Analytics: GA4 Event" tag and name the event (e.g. demo_request).
- Add parameters to enrich the event: button_text, page_location, etc.
- Test in GTM Preview mode and GA4 DebugView.
- Publish the tag once validated.
Mark your key events as conversions
Every strategic action should be tracked as a conversion (a "key event" in GA4's current wording):
- Go to Admin > Events.
- Find the event to flag (e.g. form_submit, purchase, sign_up).
- Switch on the "Mark as key event" toggle.
As soon as an event becomes a key event, it appears in all your reports with its own column. You can then measure your conversion rate by channel, page or campaign.
Implement e-commerce tracking
For online shops, send the recommended e-commerce events with their required parameters:
- view_item: product page view (with items[], value, currency).
- add_to_cart: item added to basket.
- begin_checkout: checkout started.
- purchase: completed transaction (with transaction_id, value, tax, shipping, items[]).
Implement these events via GTM or directly in the code (dataLayer). Test every step in DebugView before going live.
Use UTM parameters to track your campaigns
UTM parameters let you tag your URLs so you know exactly where your traffic comes from. They're essential for measuring how well your campaigns perform (newsletters, guest posts, social ads, etc.).
UTM structure and best practices
There are five UTM parameters:
- utm_source: the originating platform (e.g. facebook, newsletter, partner-blog).
- utm_medium: the channel type (e.g. social, email, referral).
- utm_campaign: the campaign name (e.g. black-friday-2026, product-launch).
- utm_term: (optional) to identify a paid keyword.
- utm_content: (optional) to tell apart several links in the same campaign (e.g. cta-top, cta-bottom).
Example of a tagged URL:
https://sedestral.com/?utm_source=linkedin&utm_medium=social&utm_campaign=ga4-guide&utm_content=organic-post
Golden rule: be strict and consistent. Facebook, facebook and fb will be read as three different sources. Set a clear naming convention and document it for your whole team.
Analyse your campaigns in Google Analytics
Once your URLs are tagged, the data flows automatically into Reports > Acquisition > Traffic acquisition. Filter by utm_campaign to compare performance, conversions and ROI for every marketing action.
Create a "Newsletter UTM traffic" segment to isolate the impact of your email sends, or an "SEO guest posts" segment to measure the quality of the referral traffic coming from your external articles.
Build custom reports with Explorations
The Explorations tool (Explore in the GA4 menu) is your advanced analysis workspace. It lets you cross any dimension with any metric, way beyond the standard reports.
Get to know the Explorations interface
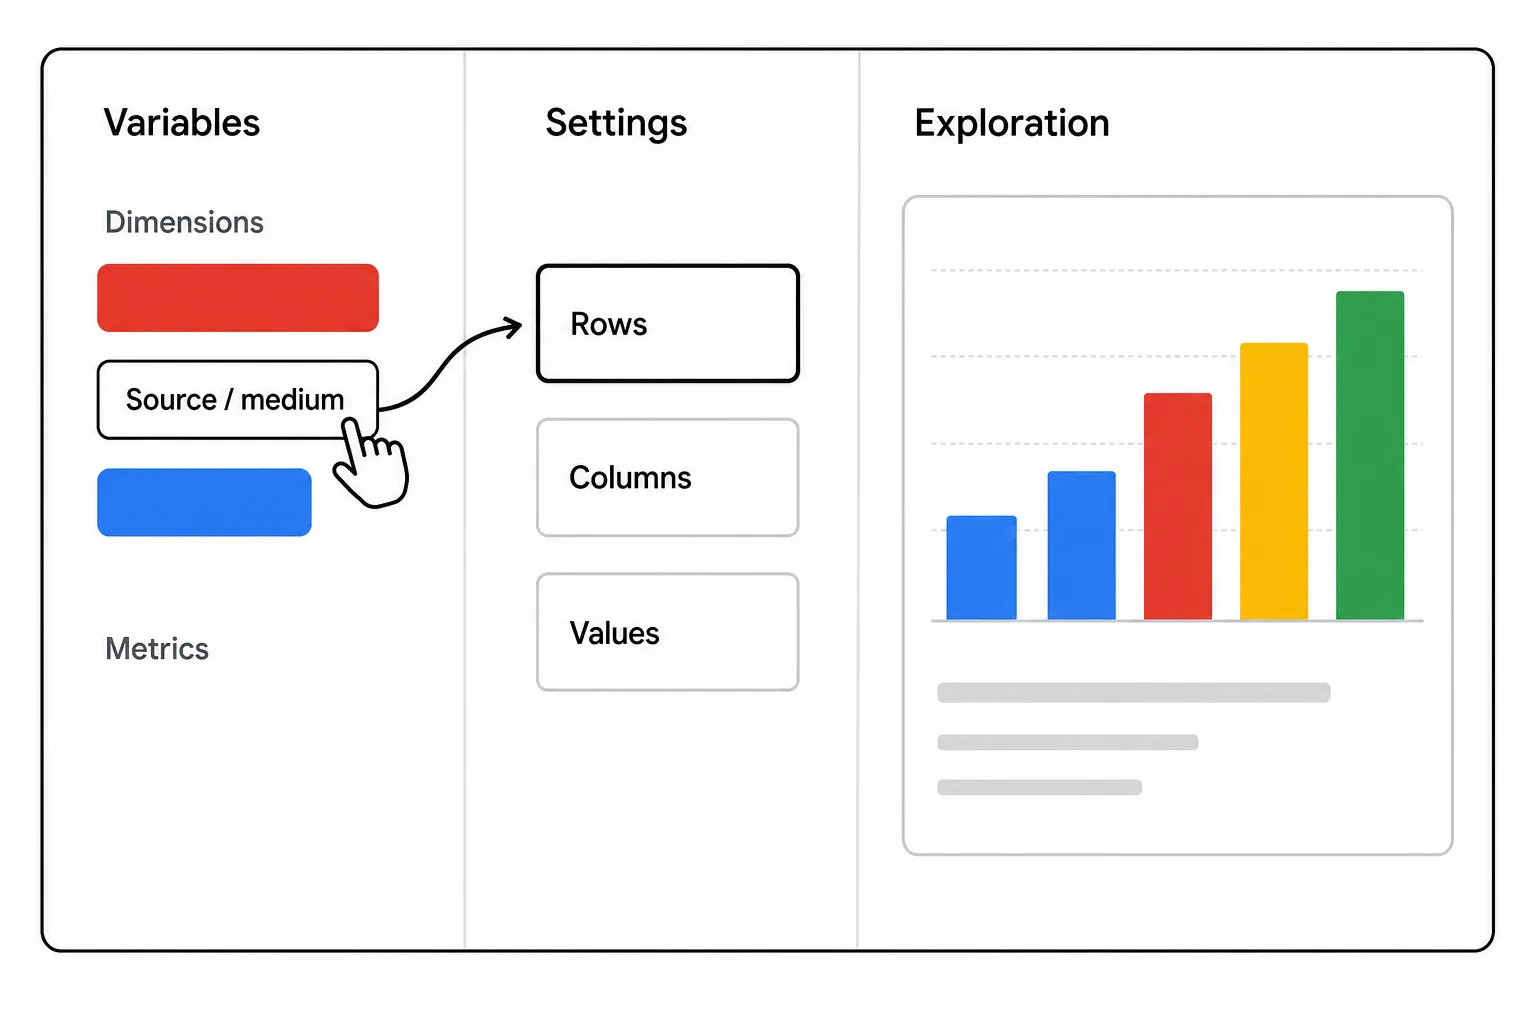
Explorations work by drag and drop:
- Variables: import dimensions (Source, Page, Device...) and metrics (Sessions, Conversions, Revenue...).
- Tab settings: define the date range, segments and filters.
- Visualisations: pivot tables, funnels, user paths, cohort analysis and more.
Example: analyse your SEO landing pages
Let's build a report to identify your best organic pages:
- Open Explore > Free form.
- Import the dimensions Landing page and Session source / medium.
- Import the metrics Sessions, Engaged sessions, Conversions and Engagement rate.
- Drag Landing page into "Rows".
- Drag the metrics into "Values".
- Create a filter: Session source / medium contains organic.
You get a powerful table listing your SEO pages by performance. Spot the ones with high traffic but low engagement and optimise those first.
Create segments to refine your analysis
Segments let you isolate subsets of users or sessions:
- "Organic mobile traffic" segment: filter on Source = Organic + Device = Mobile.
- "New visitors" segment: Session count = 1.
- "Converters" segment: Conversions > 0.
Compare several segments side by side (mobile vs desktop, new vs returning) to spot behavioural differences and adapt your strategy.
Measure and optimise your conversions
Conversion tracking sits at the core of any high-performing web strategy. GA4 helps you see what's working and what's holding your goals back.
Define your business goals
Before any technical setup, clarify your goals:
- E-commerce: purchase, add to basket, checkout started.
- Lead generation: contact form submission, quote request, white paper download.
- Media / content: newsletter sign-up, engagement time, social share.
Each goal should map to a GA4 event. Mark it as a conversion so you can track it across all your reports.
Analyse your conversion funnels
Use the "Funnel exploration" to visualise the user journey step by step:
- Step 1: view_item (product page view).
- Step 2: add_to_cart (added to basket).
- Step 3: begin_checkout (checkout started).
- Step 4: purchase (order completed).
Find out where users drop off. A high exit rate between "add to basket" and "checkout started" can point to a shipping cost issue or an over-complicated form.
Measure the value of your conversions
Assign a monetary value to each conversion to calculate ROI:
- Purchase: value = transaction amount.
- Lead generation: estimate the average value of a qualified lead (e.g. $50).
- Newsletter sign-up: estimated value based on your newsletter-to-customer conversion rate.
These values let you compare the efficiency of your acquisition channels in money, not just in volume.
Integrate GA4 into your marketing ecosystem
Google Analytics gets even more powerful once it's connected to your other tools.
Link GA4 to Google Ads
Import your GA4 conversions into Google Ads to optimise your ad campaigns:
- In GA4, go to Admin > Product links > Google Ads links.
- Select your Ads account and confirm.
- Enable conversion import to feed Smart Bidding.
Create GA4 audiences (e.g. "Visitors who viewed 3+ pages") and use them for remarketing in Ads.
Use BigQuery for advanced analysis
If you have complex analysis needs, enable the BigQuery export (Admin > Product links > BigQuery links). You'll be able to:
- Cross your GA4 data with other sources (CRM, ERP, offline data).
- Build custom attribution models.
- Calculate customer lifetime value (LTV).
- Run advanced SQL queries on raw event data.
Note: BigQuery is billed on storage and queries. Plan a budget and optimise your queries to keep costs under control.
Build dashboards with Data Studio
Data Studio (called Looker Studio from 2022 to April 2026) lets you build visual, interactive dashboards from your GA4 data:
- Connect your GA4 data source.
- Add charts (traffic trend lines, pie charts by source, conversion tables).
- Share the dashboard with your team or your clients.
- Schedule automatic deliveries (PDF by email) every week or month.
Centralise your essential KPIs: organic sessions, conversion rate, revenue, Search Console CTR, Core Web Vitals.
Comply with GDPR and manage consent
GDPR (and UK GDPR) compliance is a legal obligation for anyone with visitors in Europe or the UK. Google Analytics must be configured to respect your users' privacy.
Implement Consent Mode v2
Google's Consent Mode blocks data collection until the user has given explicit consent:
- Install a GDPR-compliant cookie banner (a CMP).
- Configure Consent Mode in GTM: GA4 tags will only fire after acceptance.
- Enable modelling: even without full consent, GA4 can estimate some aggregated metrics (without identifying individuals).
Anonymise and protect data
A few essential rules:
- Never collect personally identifiable information (PII): names, emails or addresses in events or URLs.
- Rely on IP anonymisation (GA4 never logs or stores IP addresses, by default and with no way to switch it off).
- Limit data retention: 14 months is the longest option on a standard property, and it stays within the 25-month maximum that France's CNIL sets for audience measurement data (Admin > Data settings > Data retention).
- Honour deletion requests via the User Deletion API when someone exercises their right to erasure.
Filter sensitive data out of URLs
If your URLs contain sensitive information (customer IDs, tokens), use GTM to rewrite them before they reach GA4. Create a "cleaned URL" variable that strips the problematic parameters.
Optimise your content with Google Analytics data
Once your data is flowing and reliable, use it to keep improving your site and your SEO strategy.
Identify the pages to optimise first
In Explorations, build a report crossing:
- Page (dimension).
- Organic sessions (metric, with a source = organic filter).
- Engagement rate (metric).
- Conversions (metric).
Look for pages with high SEO traffic but low engagement: they attract an audience but don't hold it. Optimise the title tag, the intro, the internal linking and the CTA.
Test and measure the impact of your optimisations
When you change a piece of content (new title tag, added FAQ, UX improvements), compare before and after:
- Create an annotation in GA4 on the date of the change.
- Compare the periods (30 days before vs 30 days after).
- Measure the shift: +20% sessions, +15% engagement rate, +10% conversions.
Document every test so you can build on what you learn and refine your strategy.
Use Google Autocomplete to enrich your content
This guide shows how to use Google Autocomplete (the search suggestions) to feed and sharpen your tracking in Google Analytics: by using private browsing and the alphabet technique to dig up long-tail keywords and understand user intent, you can bring those queries into custom segments, key events and reports to measure their impact on traffic and conversions. It also explains how to prioritise suggestions by type (informational, transactional, commercial, navigational), monitor the terms associated with your brand to manage your online reputation, and use international searches through a VPN to pick up cultural nuances. All practical steps you can apply to improve your dashboards and your SEO/UX actions alongside Google Analytics. Complete your Google Analytics guide with Google Autocomplete tips
Analyse your competitors to refine your strategy
This practical guide explains step by step how to analyse your SEO competition with the right tools: identify your real competitors, map out their keywords (with a focus on the long tail), audit the content and structure of the top-ranking pages, dig into backlink profiles and set up ongoing monitoring with dashboards. It stresses turning every insight into concrete action (on-page optimisation, topic clusters, link building) and recommends cross-checking those findings with your Google Analytics / Search Console data to prioritise quick wins and track the real impact of your changes on traffic and conversions. Read the complete guide to analysing your SEO competitors and optimising your Google Analytics tracking
Why Google Analytics 4 is a free tool you can't do without
Google Analytics 4 combines power, flexibility and a price tag of zero. Whether you're a first-time blogger or an e-commerce business, you get a professional-grade web analytics platform without spending a penny.
- Open to everyone: a Google account is all you need. No credit card, no commitment.
- Scalable: start with the basic reports, then move on to explorations, advanced segments and the BigQuery export as your needs grow.
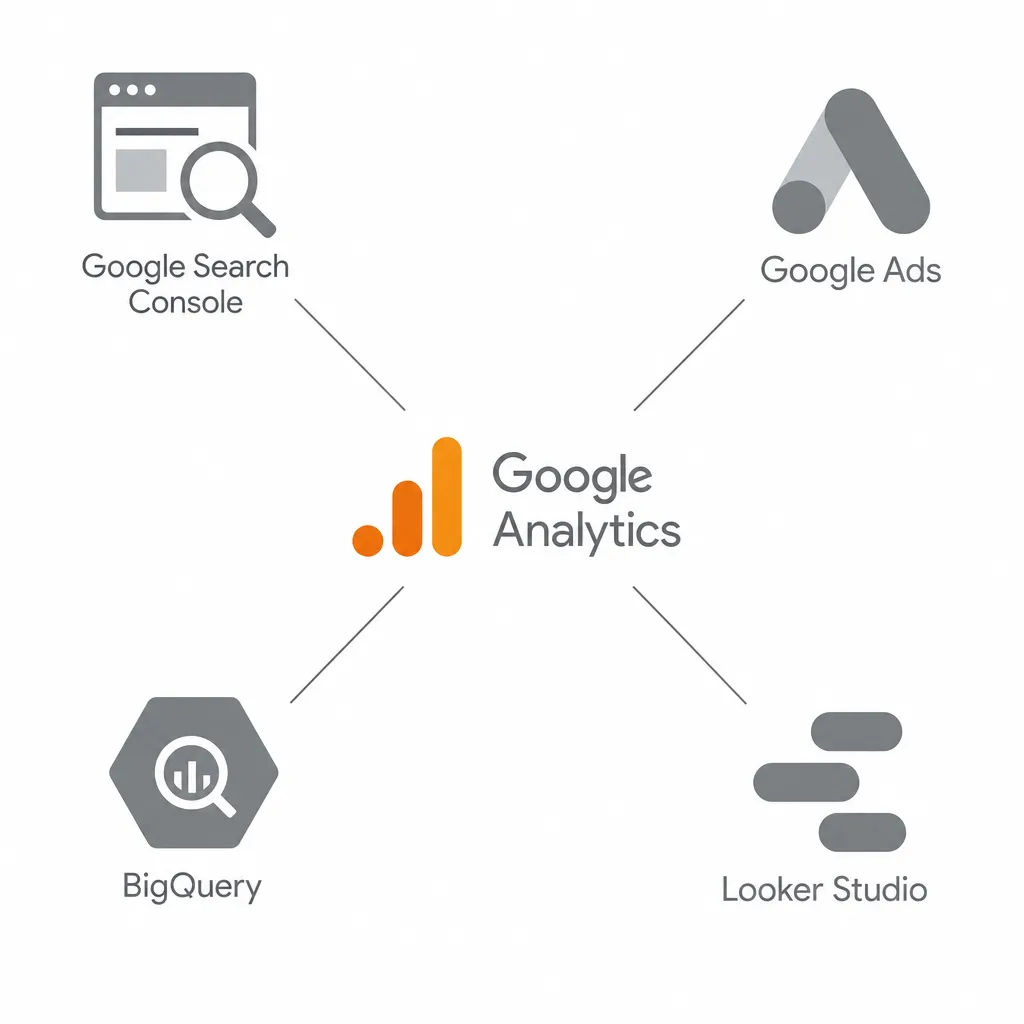
- Native integrations: connects out of the box to Google Ads, Search Console, Data Studio, Firebase, Merchant Center and more.
- Reliable data: server-side collection is available, along with Consent Mode modelling and protection against bots and spam.
Going further: a practical beginner's guide that breaks SEO down into clear steps: crawling and indexing (sitemap, robots.txt), keyword research, content creation and structure, on-page optimisation (title tag, meta description, heading tags, images), internal linking, link building and performance tracking. The guide stresses the need for a long-term strategy (3-6 months before you see results), gives concrete actions to put in place and reminds you to use essential tools such as Google Search Console, Google Analytics 4 and PageSpeed Insights to measure, analyse and adjust your SEO. Read the complete SEO guide and master Google Analytics (GA4)

Rank Higher Without the Manual Work
From technical audits with Nox to competitor monitoring with Marc, Sedestral's AI agents cover every layer of SEO so your team doesn't have to.